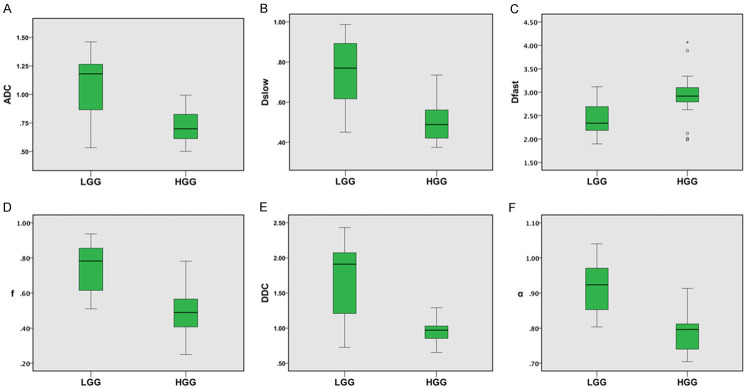
Figure 2.
Box plots of the parameters in low and high grade gliomas. 25th, 50th (median), 75th percentiles, minimum, maximum, and outliers of the parameters (A) ADC, (B) Dslow, (C) Dfast, (D) f, (E) DDC, and (F) α. All the parameters are significantly lower in HGG (P < 0.001) except Dfast which is significantly higher in HGG (P < 0.001). ADC (× 10-3 mm2/s), Dslow (× 10-3 mm2/s), Dfast (× 10-3 mm2/s), f (unitless), DDC (× 10-3 mm2/s), α (unitless).

