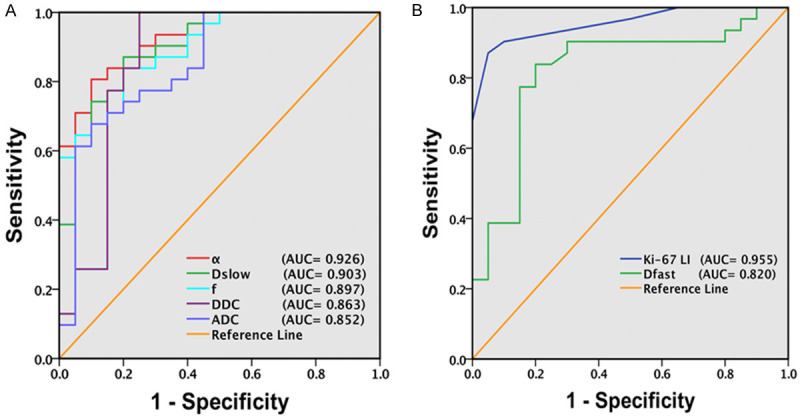
Figure 4.

ROC curve in differentiating high versus low grade gliomas by the parameters. A. Diagnostic performance of ADC, Dslow, f, DDC, and α; B. Diagnostic performance of Ki-67 LI and Dfast in differentiating HGG from LGG. AUC values in descending order were 0.955 for Ki-67 LI, 0.926 for α, 0.903 for Dslow, 0.897 for f, 0.863 for DDC, 0.852 for ADC, and 0.820 for Dfast (P < 0.001 for all) which implies diagnostic performance in the same order. ADC (× 10-3 mm2/s), Dslow (× 10-3 mm2/s), Dfast (× 10-3 mm2/s), f (unitless), DDC (× 10-3 mm2/s), α (unitless), Ki-67 LI (%), AUC = Area Under ROC Curve.
