
Figure 5.
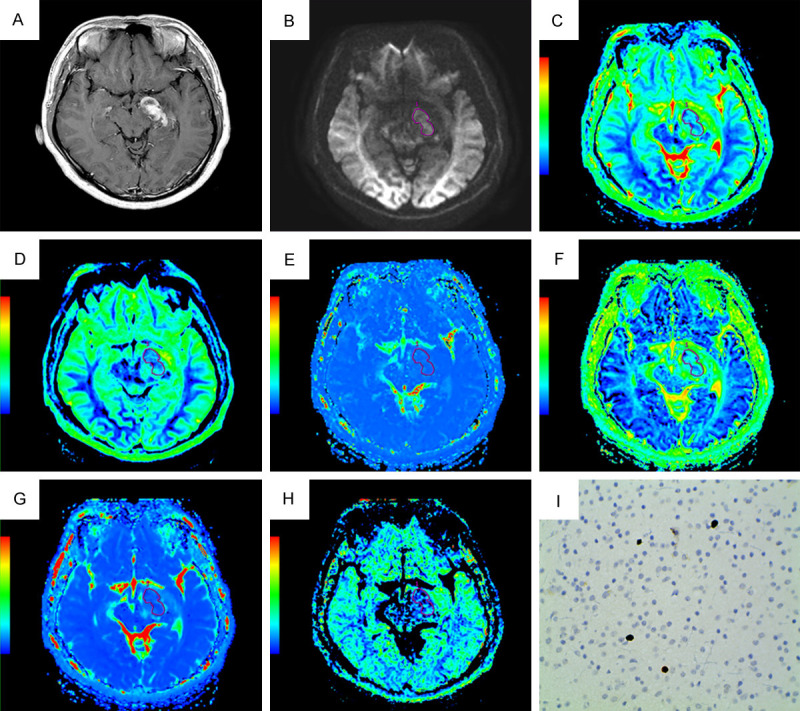
A non-homogeneously enhancing low grade glioma (WHO Grade II) in a 26-year-old male in left temporal region. (A) Contrast enhanced-T1WI, (B) DWI at b = 4500 s/mm2, (C) The ADC map, (D) The Dslow map, (E) The Dfast map, (F) The f map, (G) The DDC map, (H) The α map, and (I) Ki-67 image (400 × magnification). DWI shows increased signal intensity; the functional maps of ADC, Dslow, f, DDC and α show predominantly decreased signal values; the Dfast map shows predominantly increased signal value encoded in a green-yellow-red color schema in increasing value order. The Ki-67 LI value was 2%.