
Figure 1.
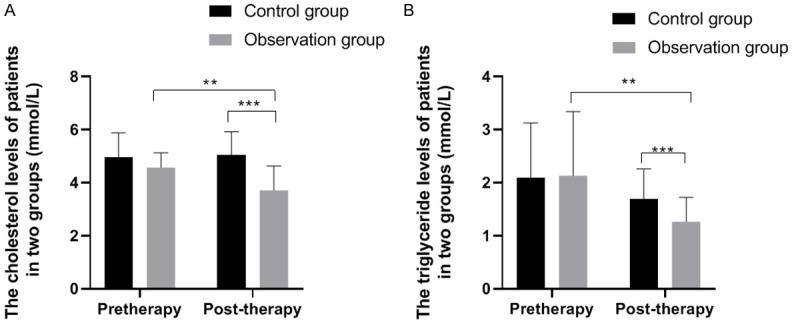
Comparison of CHO and TG levels between the two groups. Note: X: Treatment time. Y: (A) CHO level; (B) TG level. (A) The CHO levels of the control group before and after treatment were (4.97±0.91 mmol/L) and (5.03±0.89 mmol/L), while the CHO levels of the observation group before and after treatment were (4.57±0.55 mmol/L) and (3.71±0.91 mmol/L). ** and *** respectively indicate that the CHO levels of the observation group before and after treatment and between the two groups after treatment were significantly different (*: t = 4.78, P<0.01; **: t = 6.14, P<0.01). (B) The TG levels of the control group before and after treatment were (2.09±1.03 mmol/L) and (1.69±0.57 mmol/L), while the TG levels of the observation group before and after treatment were (2.13±1.21 mmol/L) and (1.26±0.46 mmol/L). ** and *** respectively indicate that the TG levels of the observation group before and after treatment and between the two groups after treatment were significantly different (*: t = 3.98, P<0.01; **: t = 3.47, P<0.01).