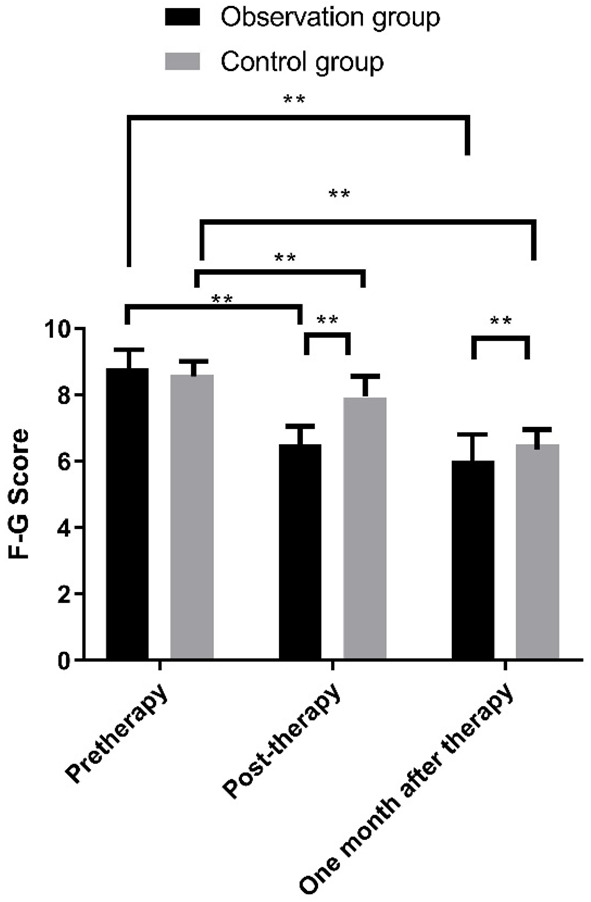
Figure 5.

Comparison of F-C scores between the two groups of patients at different time points. Note: X: Treatment time. Y: F-C score. After treatment, the WHR of the observation group patients was (6.5±2.9) lower than that before treatment (8.8±3.5) (t = 3.517, **P<0.01); The WHR of the control group patients was (7.9±3.1) lower than before treatment (8.6±3.4) (t = 4.447, **P<0.01); One month after treatment, the WHR of the observation group patients was (6.0±1.9) lower than before treatment (8.8±3.5) (t = 2.517, **P<0.01); The WHR of the control group patients was (6.5±3.1) lower than before treatment (8.6±3.4) (t = 2.347, **P<0.01); Immediately after treatment and 1 month after treatment, the WHR of observation group patients was lower than that of Control group patients (t = 6.378, **P<0.01).
