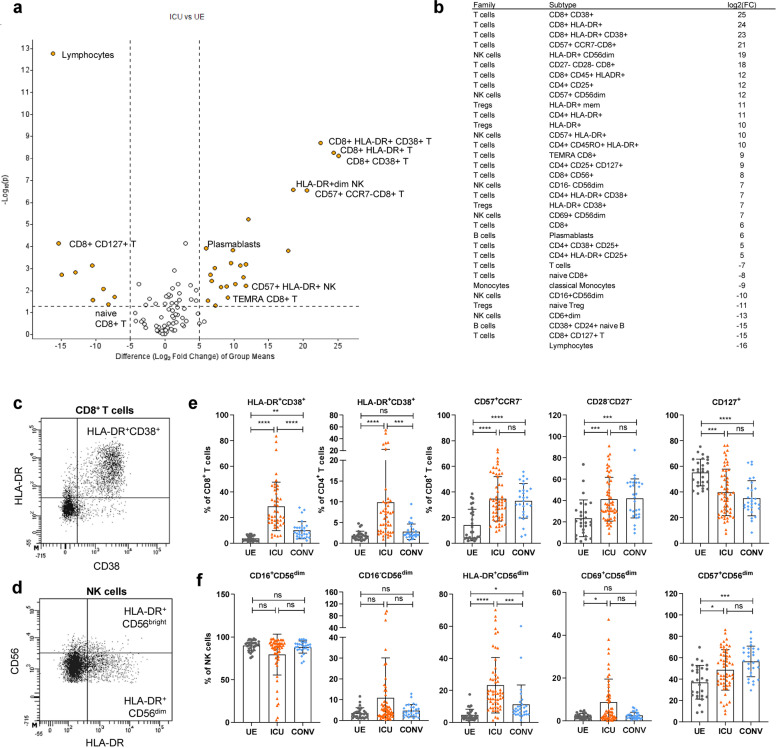
Fig. 3.
Expansion of activated and terminally differentiated T and NK cells in COVID-19 ICU patients. a Volcano plot visualizing two-group comparison of flow cytometry data including proportions of immune cells from ICU (n = 58) and UE (n = 29). b Significantly (P ≥ 0.05) altered immune cell subsets between ICU (n = 58) and UE (n = 29) ordered based on their fold change. c, d Representative flow cytometry plots. e, f Representative flow cytometry data of immune cell frequencies from UE (n = 29), ICU (n = 58) and CONV (n = 28). Statistical analysis: multigroup comparison was performed using ANOVA test with Turkey multiple comparison test or Kruskal–Wallis with test with Dunn’s multiple comparison test; *P < 0.05, **P < 0.01, ***P < 0.001, ****P < 0.0001

