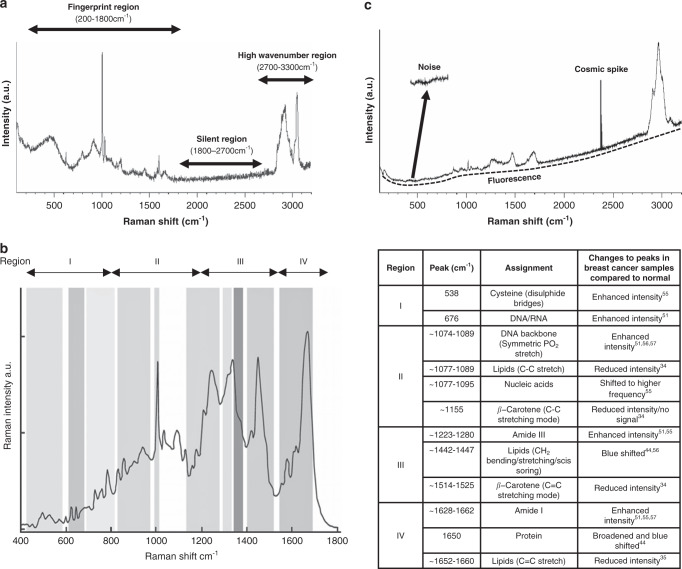
Fig. 1. Examples of Raman spectra and peak assignments.
a Extended scan from the Luminal A breast cancer cell line, MCF7 depicting the three main regions of the Raman spectrum: fingerprint, silent and high wavenumber regions are illustrated. Whilst the majority of biologically relevant molecular vibrations exist within the fingerprint, both the silent and high wavenumber regions may also contain molecular vibrations from a limited number of biomolecules. b Representation of the fingerprint region of a cellular Raman spectrum (left) with a variety of peaks that correspond to molecular vibrations of amino acids, proteins, lipids, nucleic acids and carbohydrates. Highlighted are examples of peak assignments from studies centred around the detection of breast cancer based on changes to specific Raman signatures (right). Image kindly provided by Renishaw. c Raman spectrum obtained from normal breast tissue displaying sources of spectral interference including noise, fluorescence and cosmic spikes (arrows).

