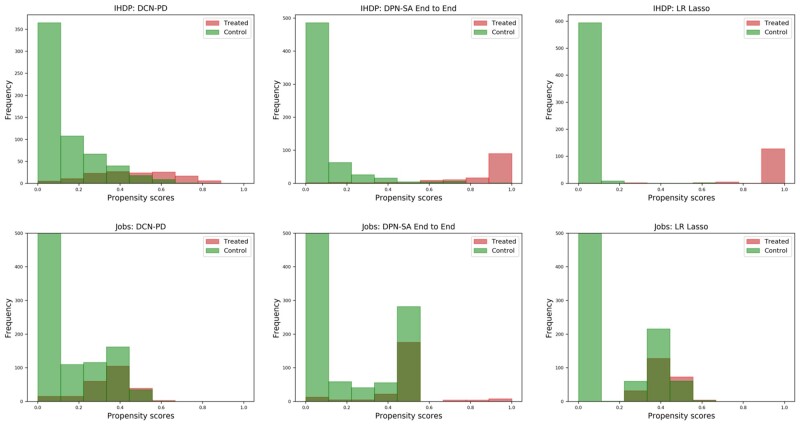
Figure 3.
Histograms of the propensity score distributions (stratified by treatment group) for the Deep Propensity Network using a Sparse Autoencoder (DPN-SA), Deep Counterfactual Network with Propensity Dropout (DCN-PD), and LASSO logistic regression (LR) on the Infant Health and Development Program (IHDP) and Jobs datasets.

