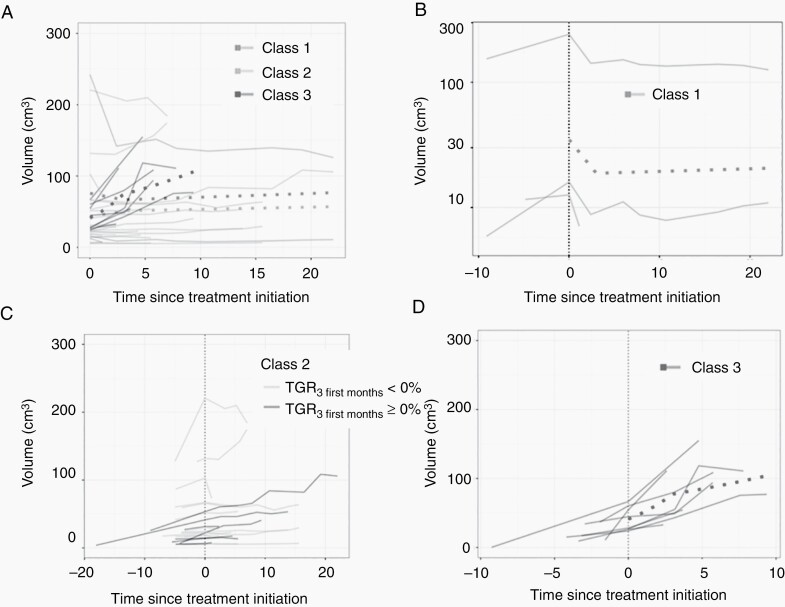
Fig. 1.
(A) Pretreatment and undertreatment growth curves of the different tumors depending on the class (1, green line; 2, blue line; and 3, redline). Dotted curves represented the mean growth curve for each class. (B) Pretreatment and undertreatment growth curves of class 1 meningioma with volume decrease then tumor stabilization. The dotted curve represented the mean growth curve of class 1 tumors. (C) Pretreatment and undertreatment growth curves of class 2 meningioma with volume stabilization or slow growth. The dotted curve represented the mean growth curve of class 2 tumors. Growth curves of the tumor with 3DVGR < 0% are represented in blue, and growth curves of the tumor with 3DVGR ≥ 0% are represented in gray. (D) Pretreatment and undertreatment growth curves of class 3 meningioma with high-volume increase. The dotted curve represented the mean growth curve of class 3 tumors. Abbreviations: 3DVGR, 3D volume growth rate; TGR, tumor growth rate.

