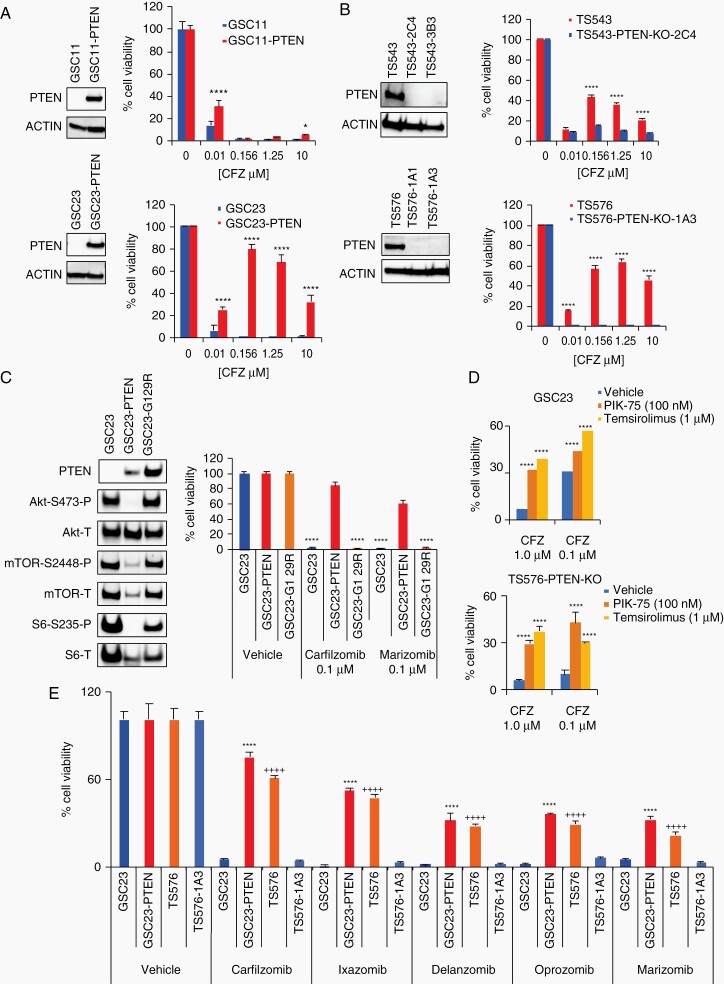
Fig. 2.
Proteasome inhibition sensitivity relies on PTEN. A and B, Drug dose responses in glioblastoma stem cell (GSC) parental cells and -derived clones. A, PTEN-null parental cells (GSC11 and GSC23, blue) and engineered to overexpress PTEN (GSC11-PTEN, GSC23-PTEN, red). B, PTEN-WT parental cells (TS543 and TS576, red) and PTEN-KO CRISPR clones (TS543-2C4, TS543-3B3, TS576-1A1, TS576-1A3, blue). Left panels, immunoblots with anti-PTEN and anti-ACTIN (as loading control). Right panels, drug dose-response curves (n = 5 replicas per concentration, two-way ANOVA, multiple comparisons against vehicle (0), *P < .05, ****P < .0001). C, Cell viability in GSC cells overexpressing a PTEN enzymatic dead construct (G129R). Left panels, immunoblots with anti-AKT, -mTOR, and -S6 (P: phosphorylated, T: total). Right panels, cell viability assay at 48 hours in GSCs overexpressing PTEN-WT or PTEN-G129R (n = 3 replicas per concentration, two-way ANOVA, multiple comparisons against vehicle, ****P < .0001). D, Bar plots showing changes in cell viability in PTEN-null cells (GSC23 upper panel and TS576-PTEN-KO bottom panel) treated with carfilzomib alone (CFZ, 1 μM and 0.1 μM) or in combination with a PI3K inhibitor (PIK-75, 100 nM) or mTOR inhibitor (Temsirolimus, 1 μM) for 48 hours (n = 3 replicas per concentration, two-way ANOVA, multiple comparisons against vehicle, ***P < .001, ****P < .0001). E, Cell viability assay with different chemically distinct proteasome inhibitors (0.1 μM) (n = 3 replicas per concentration, two-way ANOVA, multiple comparison against GSC23 (*) or TS576-1A3 (+), ****/++++P < .0001). Error bars represent the SEM from different independent experiments.

