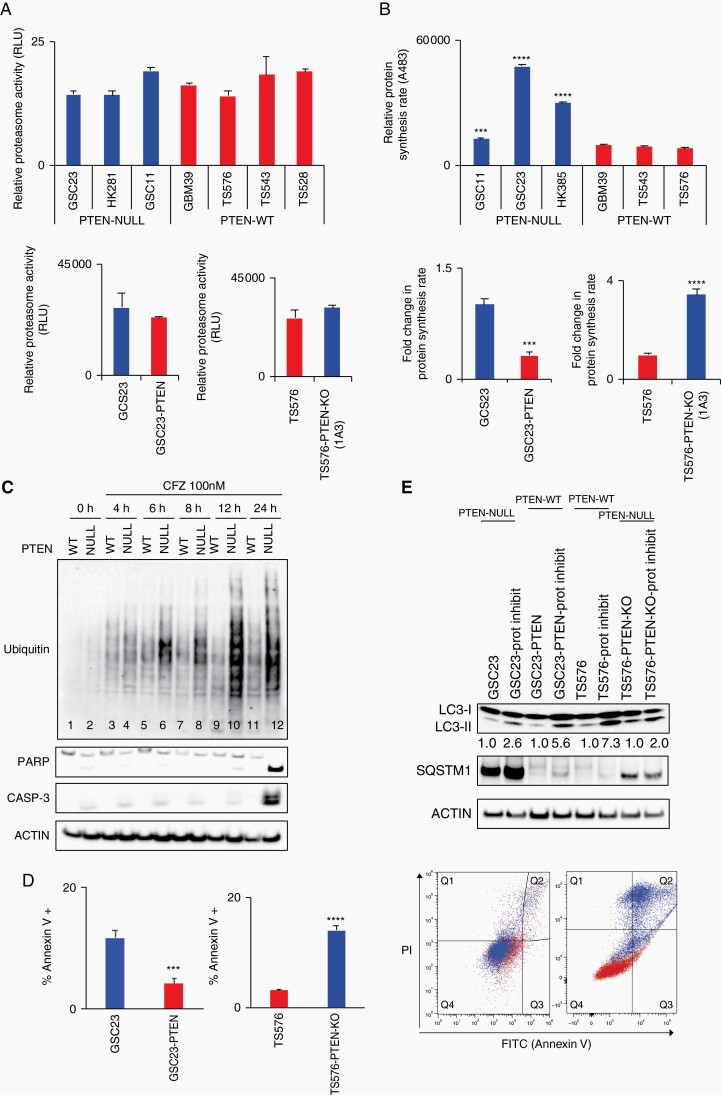
Fig. 3.
Protein synthesis and autophagy regulate proteasome inhibition response. A, Proteasome activity quantification in glioblastoma stem cells (GSCs) (upper panel) and derived clones (bottom panel). Proteasome activity was determined by quantification of the fluorophore 7-amino-4-methylcoumarin coupled to substrate LLVY-AMC (chymotrypsin-like substrate) (n = 3, no significant differences). B, Relative protein synthesis quantification in GSCs (upper panel) and PTEN-derived clones (bottom panel). Protein synthesis rate was determined by quantification of O-propargyl-puromycin (OPP) incorporation into translating polypeptides after 2 hours (top panel, n = 3, two-way ANOVA, multiple comparisons, ***P < .001, ****P < .0001; bottom panel, n = 3, t-test ***P < .001, ****P < .0001). C, Immunoblot analysis of poly-ubiquitinated (Ub) proteins and apoptosis markers (PARP and caspase-3) in PTEN-WT (TS576) and PTEN-null (TS576-1A3) cells treated with 100 nM carfilzomib at indicated time points. D, Right panel, apoptosis quantification by Annexin V FACS staining in PTEN-null (GSC23 and TS576-PTEN-KO) and PTEN-WT (GSC23-PTEN and TS576) cells treated with 100 nM carfilzomib per 24 hours (n = 3, t-test, ***P < .001, ****P < .0001). Left panel, representative quadrant dot-plot of percentages of cells in each subpopulation. E, Immunoblot analysis of markers of autophagy (LC3-II and SQSTM1) in GSCs PTEN-null (GSC23 and TS576-PTEN-KO) and PTEN-WT (GSC23-PTEN and TS576) untreated or treated with 100 nM carfilzomib for 48 hours. Densitometric analysis of LC3-II normalized to untreated group for each GSC condition. PI, propidium iodide; Prot inhibit, proteasome inhibitor;. Error bars represent SEM from 3 different independent experiments.

