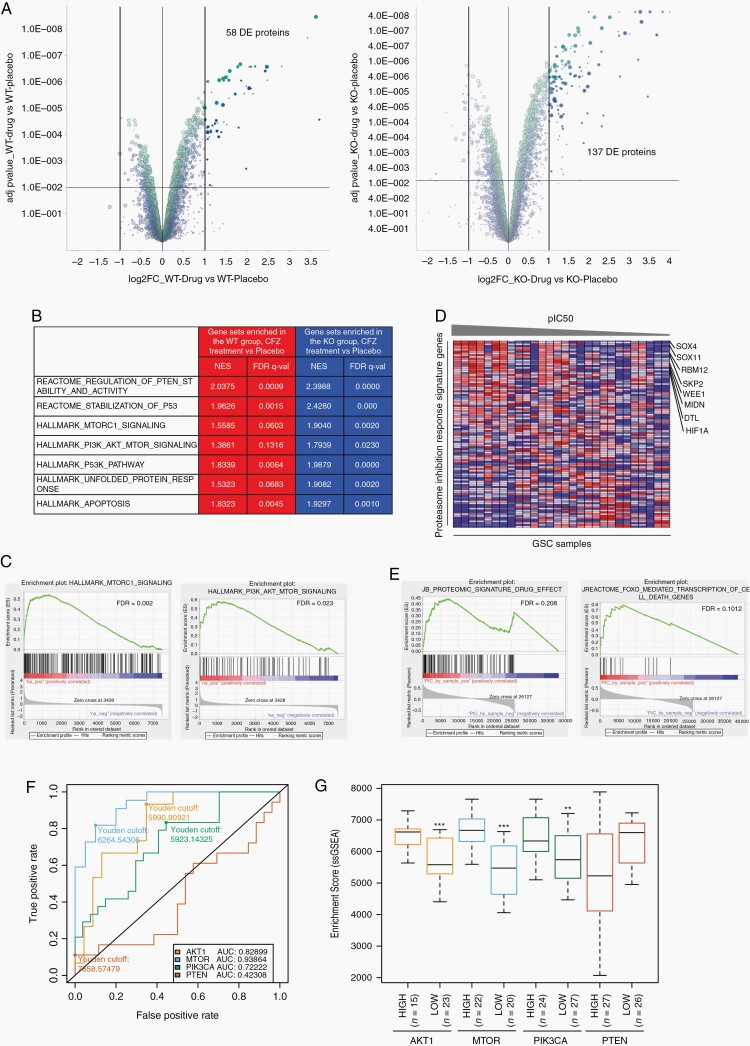
Fig. 4.
Proteomic and bioinformatic analysis in proteasome inhibitor-treated GSCs. A, Volcano plot of DE proteins, highlighted in dark green and dark blue, in PTEN-WT (left panel) and -KO (right panel) GSCs after carfilzomib treatment (CFZ 100 nM, 12 hours) compared with placebo group (adj. P-value < .001 and log 2-fold change). B, Table showing representative gene sets enriched in PTEN-WT (red) and PTEN-KO (blue) after CFZ treatment. C, GSEA plot of MTORC1 signaling (NES = 1.9040, FDR = 0.0020) and PI3K/AKT/mTOR signaling (NES = 1.9879, FDR = 0.0) in PTEN-KO GSCs treated with CFZ. D, pIC50 (−log10(IC50[M])) sorted heatmap of gene expression in GSCs for the PIRS. Expression values represented as colors (red = high, pink = moderate, light blue = low, dark blue = lowest). Representative genes upregulated in GBM indicated at the right side (n = 28 GSC samples). E, GSEA enrichment plot of PIRS (NES = 1.27, FDR = 0.191) and FOXO (NES = 1.89, FDR = 0.1012). F, AU-ROC analysis of the PIRLE signature in TCGA GBM samples subset by MTOR, AKT1, PIK3CA, and PTEN gene expression level (high vs low). True-positive rate = high expression; False-positive rate = low expression. G, Boxplot of ssGSEA enrichment scores of the PIRLE signature for AKT1, MTOR, PIK3CA, and PTEN high vs low TCGA GBM samples (Wilcox test, **P < .01, ***P < .001). CFZ: carfilzomib 100 nM for 12 hours. Abbreviations: AU-ROC, area under the receiver operating characteristic curve; DE, differentially enriched; FDR, false discovery rate; GSCs, glioblastoma stem cells; NES, normalized enrichment score; PIRLE, Proteasome Inhibition Response Leading Edge; PIRS, Proteasome Inhibition Response Signature; Placebo, DMSO; Prot Inhibit, proteasome inhibitor.

