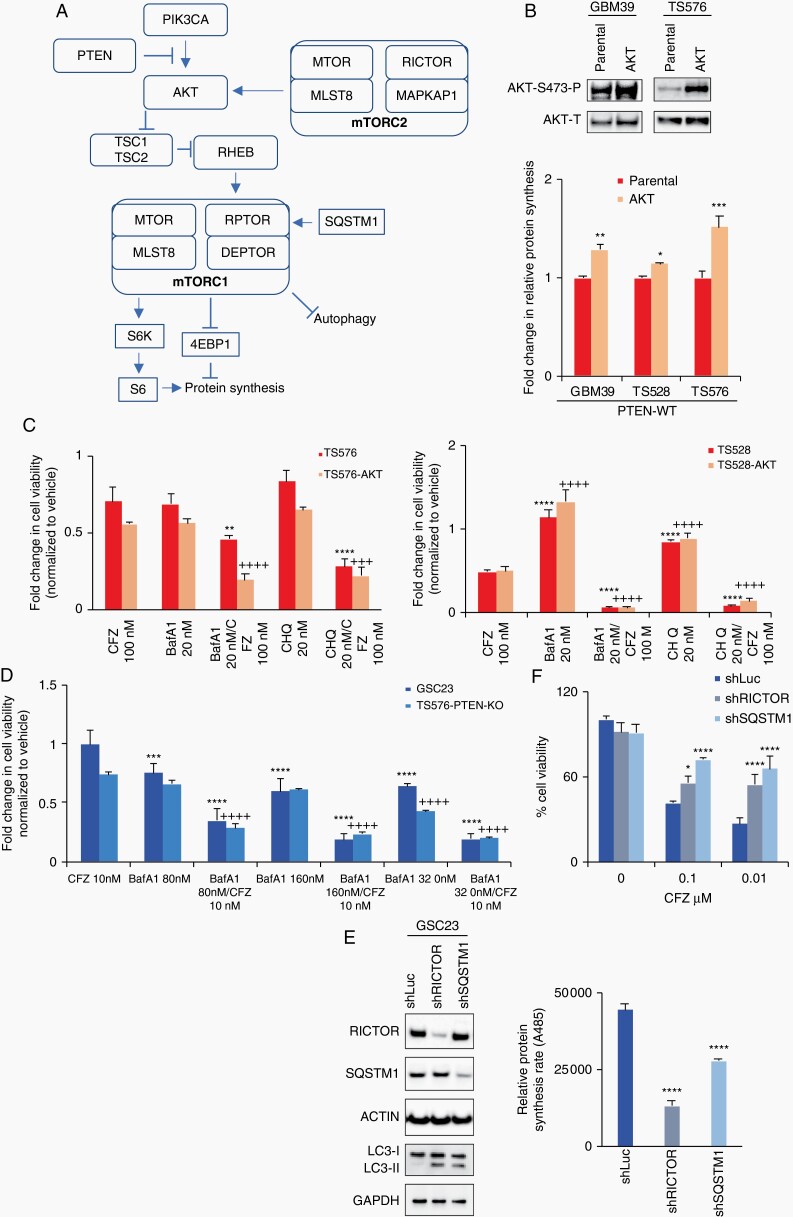
Fig. 5.
Autophagy modulation sensitizes glioblastoma stem cells (GSCs) to proteasome inhibition. A, Schematic diagram of the PI3K/mTOR pathway indicating key components involved in the proteasome inhibition response (PTEN, AKT, mTORC2, mTORC1, and SQSTM1). B, Upper panel, immunoblot analysis of AKT activation. Bottom panel, relative protein synthesis rate in parental cells and overexpressing constitutively active AKT (n = 3, two-way ANOVA, multiple comparisons, *P < .05, **P < .01, ***P < .001). C and D, Cell viability assays on cells treated with carfilzomib alone (CFZ 100 nM, 48 hours) and in combination with autophagy inhibitors bafilomycin A1 (BafA1) or chloroquine (CHQ) in PTEN-expressing (C) and PTEN-KO GSCs (D) (n = 3, two-way ANOVA, multiple comparisons against CFZ; parental (*) or AKT (+) or KO (+), **/++P < .01, ***/+++P < .001, ****/++++P < .0001). E, Left panel, immunoblots of cells transduced with lentivirus shRNA anti-RICTOR and anti-SQSTM1. Right panel, relative protein synthesis rate quantification in GSCs sh-Control (shLuc), shRNA anti-RICTOR and anti-SQSTM1 (n = 3, one-way ANOVA, multiple comparisons against shLuc, ****P < .0001). F, Cell viability assay in shControl, shRICTOR and shSQSTM1 GSCs untreated or treated with 100 nM carfilzomib per 48 hours (n = 3, two-way ANOVA, multiple comparisons against shLuc, *P < .05, ***P < .001, ****P < .0001). Error bars represent the SEM from 3 different independent experiments.

