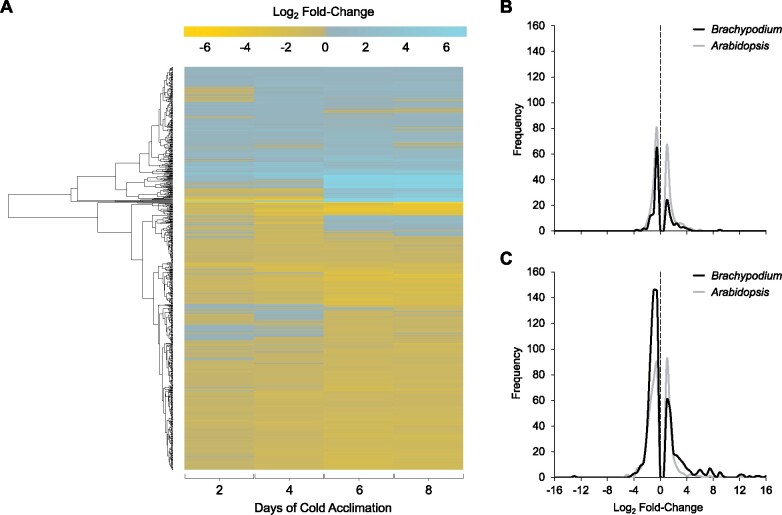
Figure 2.
Global impact of CA on the B. distachyon PM proteome. (A) A heatmap showing the 848 proteins in the PM-enriched fractions with significant changes in relative abundance between nonacclimated and cold-acclimated samples following 2, 4, 6, or 8 days at 2°C. Data are mean fold-changes relative to nonacclimated plants based on four replicates and are presented as log2-transformed values. Hierarchical clustering analysis was used to group proteins displaying similar abundance proteins, and the results are presented by the dendrogram along the left-hand side of the figure. (B, C) Frequency distribution of log2 fold-changes shown for proteins with significant changes in relative abundance at (B) early CA (2 days for B. distachyon and 2 days for A. thaliana) and (C) sustained CA (6 days for B. distachyon and 7 days for A. thaliana). Log2 fold-change values of 0 are highlighted with a dotted line. Data were plotted using fold-change value bin widths of 0.5. Raw A. thaliana data were obtained from Miki et al. (2019) and reanalyzed to obtain fold-changes matching thresholds used in this manuscript of P < 0.05 and a fold-change >1.5 or <0.67 as opposed to >2.0 and <0.5 employed by Miki et al. (2019).

