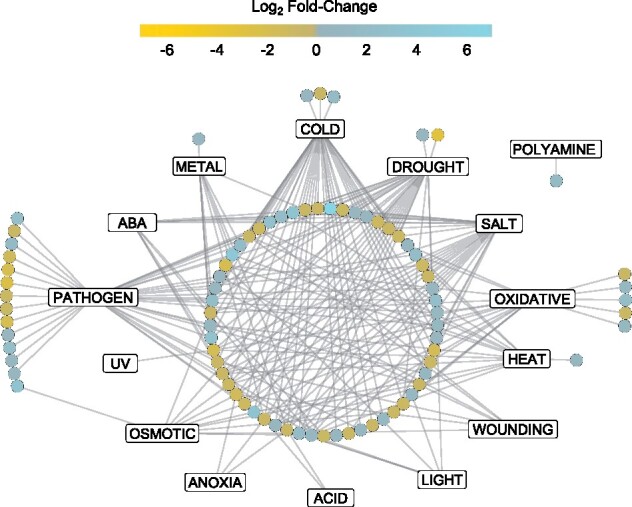
Figure 5.

Network illustrating involved stress pathways and crosstalk between proteins significantly changed in relative abundance at 2 days of CA. Rectangle nodes represent functional protein stress response pathways while circular nodes represent individual proteins. Edges connecting protein nodes to stress response nodes represent validated functional associations from the literature. Protein function in the stress pathways was validated via Uniprot and the literature, and networks were built using Cytoscape version 3.8.1. Node color represents log2 fold-change of the protein in the cold-acclimated (2 days) vs nonacclimated PM proteomes. An interactive version of the network with encoded metadata is available in Supplementary File S10. Click on a node to see individual protein accession ID, protein description, log2 fold-change, predicted functional categories, and degrees of interaction. Click on an individual edge to see the literature for the specific protein–stress response relationship.
