Figure 6.
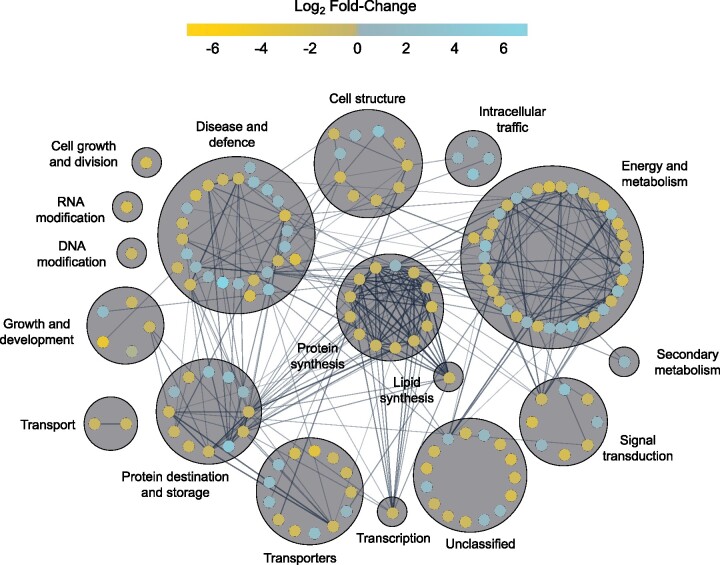
Predicted protein–protein interaction network of all proteins at 2 days of CA. Nodes represent individual proteins (154) with node color representing the respective log2 fold-change of the protein in the cold-acclimated (2 days) vs nonacclimated PM proteomes. Edges between connected nodes represent predicted protein–protein interactions. Nodes are grouped based on predicted functional categories and labeled accordingly. Nodes on the outer circle of a main functional group have predicted functions in secondary categories. Interactions were predicted via STRING version 11 and the network was prepared using Cytoscape version 3.8.1. Darker and thicker edges between nodes represent stronger supporting data for the respective interaction. An interactive version of the network with encoded metadata is available in Supplementary File S11. Click on a node to see individual protein accession ID, protein description, log2 fold-change, functional categories, and degrees of interaction.

