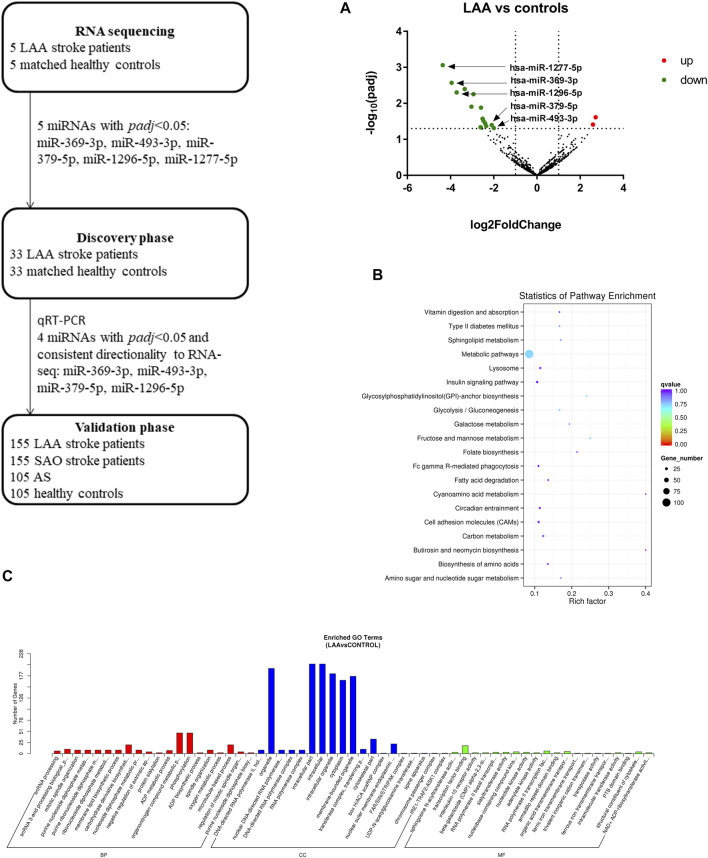
FIGURE 2.
Workflow and RNA sequencing results. Target analysis of miRNAs differentially expressed in enriched exosome fractions from LAA and control plasma samples. GO/KEGG enrichment was performed on differentially expressed miRNAs identified in exosome-enriched plasma, and miRNA analysis was performed. (A). Volcano map showing the high-throughput sequencing results for LAA vs. healthy control samples; red indicates upregulation, and green indicates downregulation. (B). Bubble plot of the KEGG pathway enrichment results. (C). Bar plot of the GO enrichment results (biological process, cellular component, and molecular function categories).

