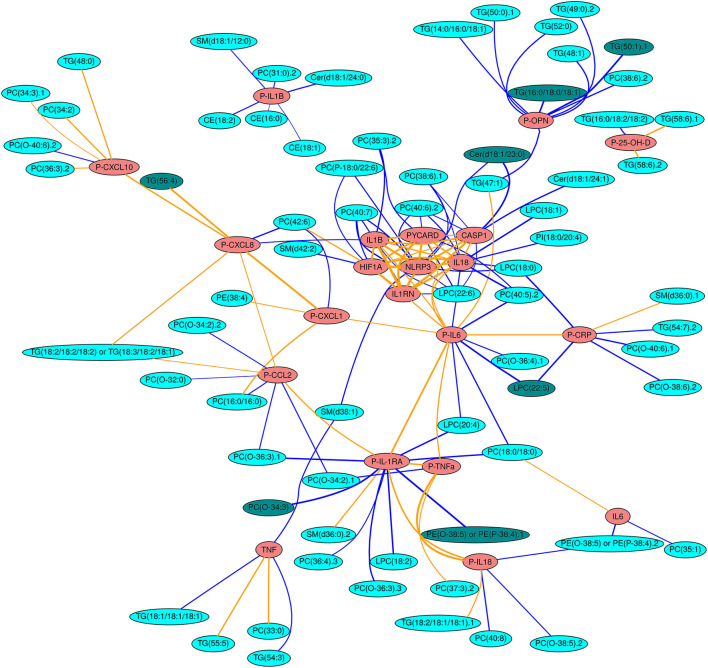
Figure 2.
Network projection of all non-spurious (NRR < 0.1) correlations between immune mediators and lipids. Red nodes indicate gene expression data or plasma protein data (P-) of immune mediators and cyan nodes indicate circulating lipids. The darker shade of cyan indicates the lipids with the strongest (≥0.5), correlations across all patients (see Methods). Blue lines denote negative correlations, whilst orange lines denote positive correlations. The thickness of the lines is scaled to the magnitude of the correlation.

