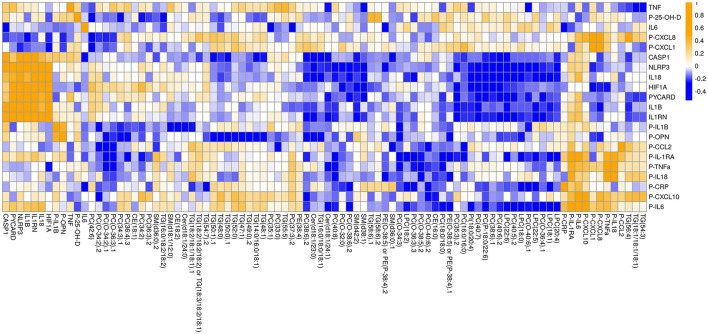
Figure 3.
Inflammatory-mediator-centric heatmap of significant (p < 0.05 in ANOVA/TukeyHSD analyses) associations between inflammatory mediator and lipids, as measured by qPCR, electrochemiluminescent multiplex assay and UHPLC-QTOFMS. Lipid-lipid interactions were pruned from the original list of associations by assigning all lipid-lipid interactions with an NRR of 1. Circulating cytokines are indicated with P. Orange colour denote positive correlation and blue colour denotes negative correlations.

