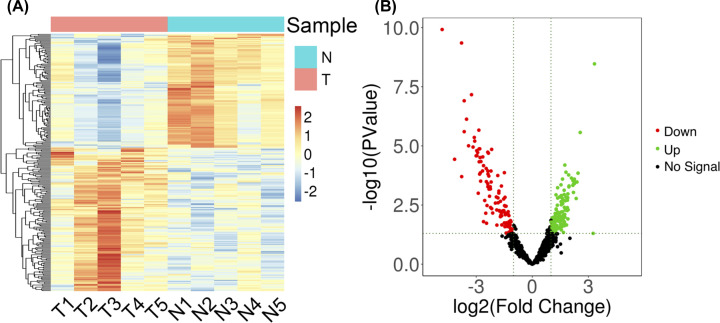
Figure 1. Differentially expressed miRNAs in HCC patients vs healthy controls detected with RNA-seq.
(A) Heatmap demonstrating genes that were differentially expressed between platelets derived from HCC patients and controls. (B) Volcanic map showing differential gene expression. Genes with corrected P-value <0.05 and |log2FC| >1 were defined as differentially expressed genes. N, normal; T, tumor.

