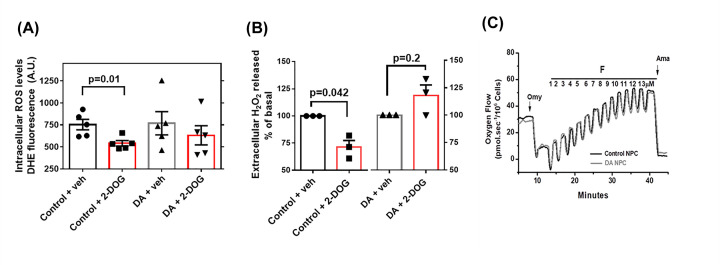
Figure 2. Dopamine treatment impairs the regulation of ROS by mitochondrial hexokinase with no change in mitochondrial function.
(A) Quantification of the intracellular levels of O●− by DHE fluorescence after activation of hexokinase with 2-DOG 35 mM for 30 min in control versus dopamine-treated NPCs. In all experimental conditions we used 5 × 10⁴ cells/ml. (B) Normalized quantification of the rate of H2O2 release after the activation of hexokinase with 2-DOG 35 mM for 30 min in control versus dopamine-treated NPCs. For a sake of clarity, the scale range chosen was from 50 to 160. The differences between groups were analyzed by unpaired t-test in a (n = 5 per group) and by unpaired t-test with Welches correction in b (n = 3 per group). (C) Representative oxygraphic data of mitochondrial function from control and dopamine-treated NPCs in response to sequential additions of 1 µg/ml Oligomycin (Omy), 1 µM pulses of FCCP (F) and 2.5 µM antimycin A (Ama); Veh, vehicle.

