FIGURE 2.

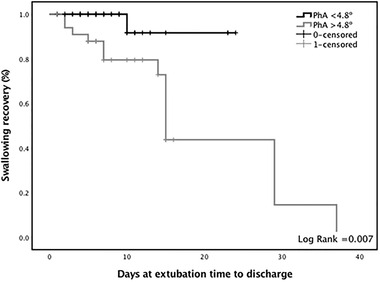
Phase angle (PhA) related to the length of stay and restitution of oral intake. The black line represents those with a PhA lower than 4.8°, whereas the gray line represents those with a PhA over 4.8°

Phase angle (PhA) related to the length of stay and restitution of oral intake. The black line represents those with a PhA lower than 4.8°, whereas the gray line represents those with a PhA over 4.8°