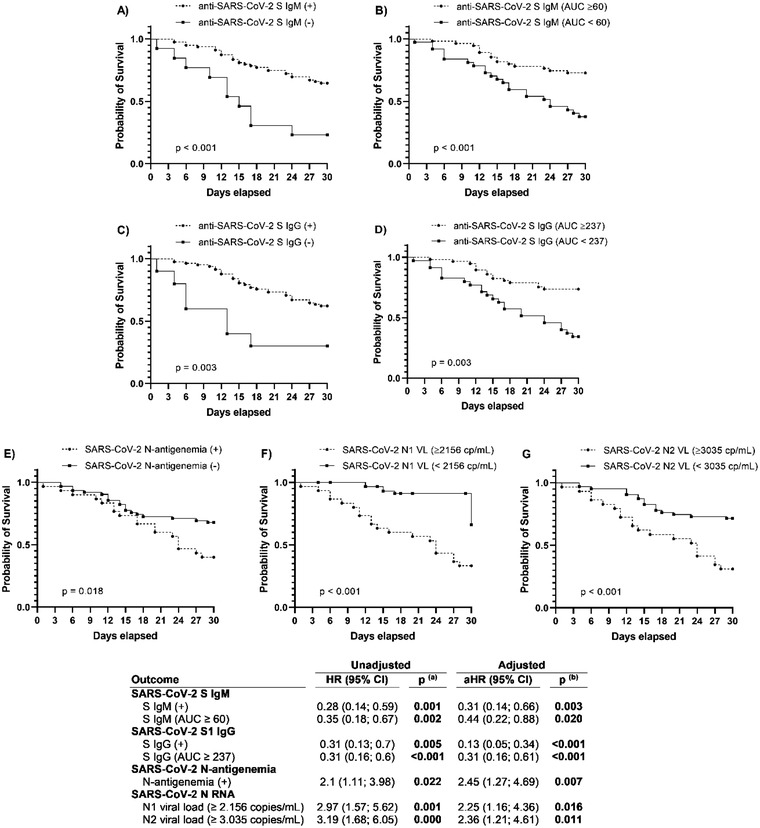
Fig. 2.

Upper panel: Kaplan–Meier curves to represent survival by day 30 following ICU admission depending on the presence or absence of SARS‐CoV‐2 S antibodies (IgM, IgG) (a and c), the presence or absence of antigenaemia (e), the presence of higher/lower levels of SARS‐CoV‐2 S antibodies (IgM, IgG) (b and d) or viral RNA load in plasma (N1,N2) (f and g). Lower panel: Cox regression analysis to assess risk of 30‐day mortality following ICU admission. Statistics: p‐values were calculated by univariate (a) and multivariate (b) analysis adjusted by the most relevant covariates (see Statistical Analysis section). Significant differences are shown in bold
Abbreviations: 95% CI, 95% confidence interval; aHR, adjusted HR; HR, hazard ratio; p‐value, level of significance.
