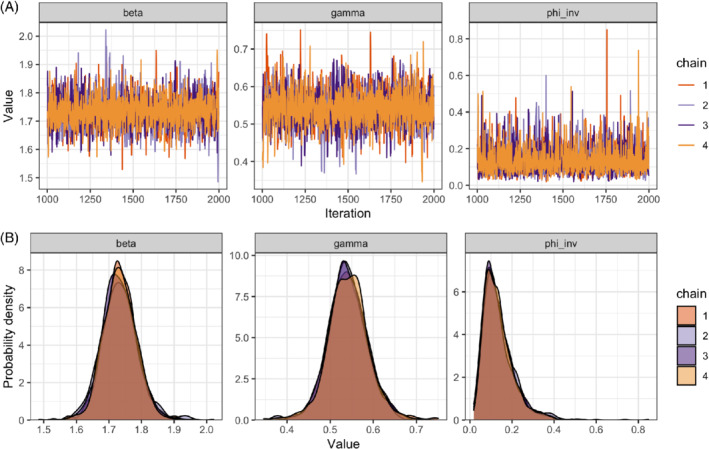
FIGURE 6.

A, Trace plot showing the value of each chain at each iteration (excluding warm‐up) and B, marginal posterior densities for the transmission rate (beta or ), the recovery rate (gamma or ) and the inverse dispersion parameter (phi_inv or ), separately for each of the four Markov chains [Colour figure can be viewed at wileyonlinelibrary.com]
