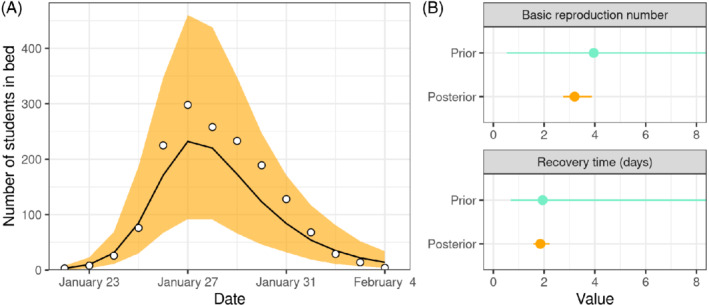
FIGURE 8.

A, Posterior predictive check of the number of students in bed each day during an influenza A (H1N1) outbreak at a British boarding school. The line shows the median and the orange area the 90% prediction interval. B, Prior and posterior predictive checks of the basic reproduction number and of the recovery time (both truncated at 8). The dot shows the median posterior and the line shows the 95% credible interval [Colour figure can be viewed at wileyonlinelibrary.com]
