
FIGURE 10.
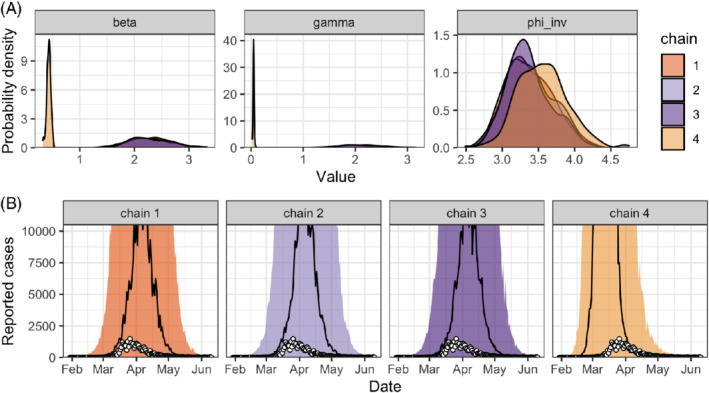
A, Posterior distributions of the model parameters (the transmission rate , the recovery rate and the inverse dispersion parameter ) and B, chain‐by‐chain posterior predictive check of the number of reported cases for the simple SIR model (model iteration #1) applied to data on the SARS‐CoV‐2 epidemic in Switzerland (white circles). SARS‐CoV‐2, severe acute respiratory syndrome coronavirus 2; SIR, susceptible‐infected‐recovered [Colour figure can be viewed at wileyonlinelibrary.com]