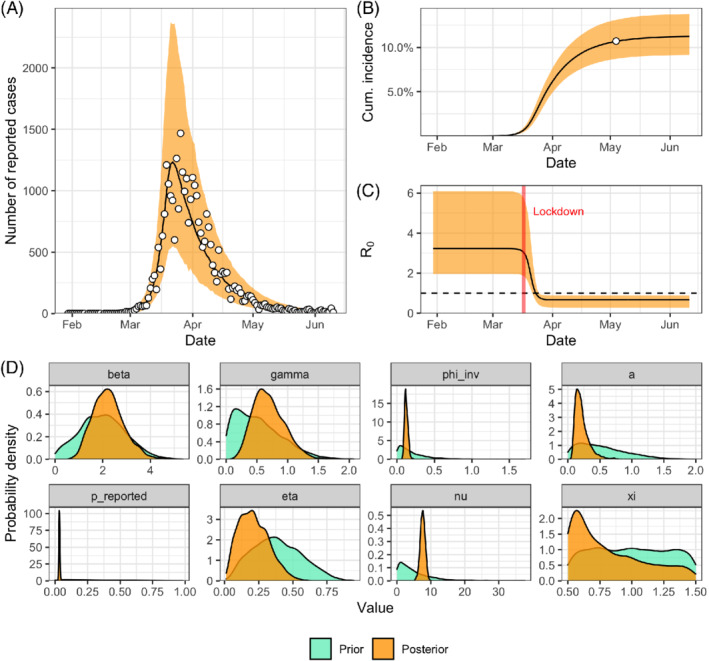
FIGURE 14.

(A) Posterior predictive check of the number of reported cases and (B) of the cumulative incidence for the SEIR model including the effect of control measures and fitted to both reported cases and seroprevalence data (model iteration #7; white circles show data on reported cases in panel A and seroprevalence data in panel B). (C) Posterior distribution of the forcing function f that models the reduction in transmission after the introduction of lockdown measures. (D) Prior and posterior distributions of the parameters of model iteration #7 [Colour figure can be viewed at wileyonlinelibrary.com]
