
Fig 1.
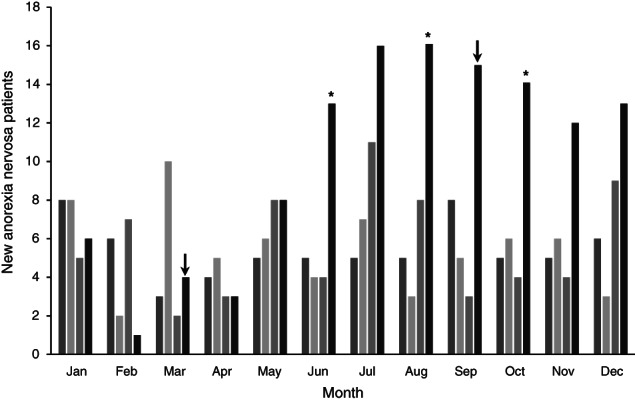
New presentations (AN and atypical AN) by month, 2017–2020. ( ), 2017; (
 ), 2018; (
 ), 2019; (
 ), 2020. (↓) Beginning and end of lockdown. *P‐value < 0.05.
Official websites use .gov
A
.gov website belongs to an official
government organization in the United States.
Secure .gov websites use HTTPS
A lock (
) or https:// means you've safely
connected to the .gov website. Share sensitive
information only on official, secure websites.
New presentations (AN and atypical AN) by month, 2017–2020. (), 2017; (), 2018; (), 2019; (), 2020. (↓) Beginning and end of lockdown. *P‐value < 0.05.