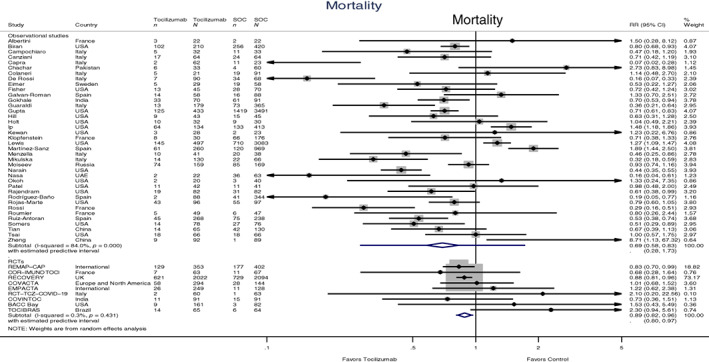
FIGURE 2.

Forest plot of mortality risk ratios (RRs) comparing tocilizumab and control treatment. Sample sizes are given for participants receiving intervention and participants receiving standard of care treatment (SOC), included in the study, when data were available. Summary estimates are presented separately for observational studies and randomized controlled trials (n, deaths; N, group size)
