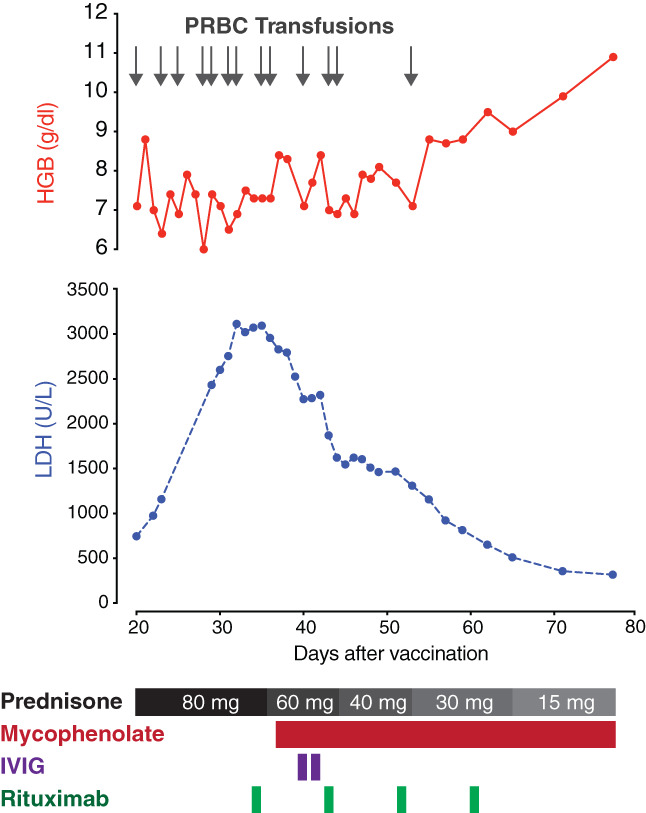
FIGURE 1.

Hemoglobin and LDH trends, and response to treatment. The X‐axis represents the number of days following receipt of the first dose of the SARS‐CoV‐2 mRNA‐1273 vaccine. The Y‐axes represent hemoglobin (above) and LDH concentrations (below). Gray arrows represent RBC transfusions. Black and gray rectangles indicate the prednisone taper. MMF, IVIG, and rituximab are depicted in red, purple, and green, respectively. IVIG, intravenous immune globulin; LDH, lactate dehydrogenase; MMF, mycophenolate mofetil; pRBCs, red blood cells [Color figure can be viewed at wileyonlinelibrary.com]
