
FIGURE 1.
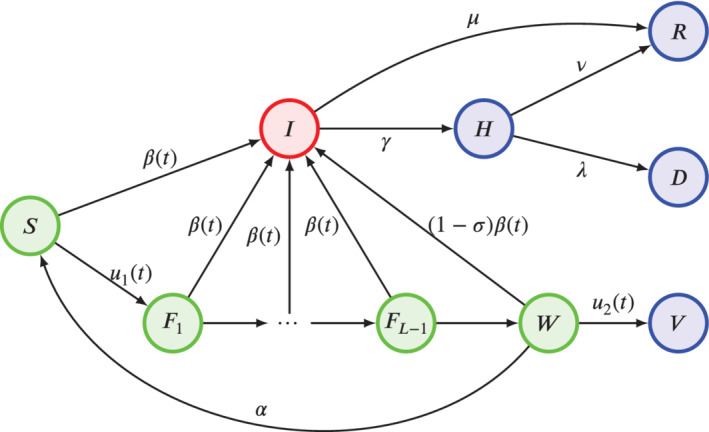
Schematic of the epidemic process. Colors are used to denote different infectiousness statuses. Green nodes are susceptible to the disease (with those in W with a reduced risk due to partial immunity); the red node denotes individuals that are infectious; blue nodes are individuals that are nor infectious nor susceptible (because recovered, dead, isolated, or fully vaccinated)