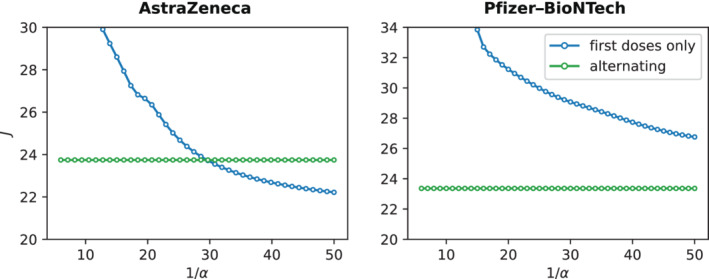
FIGURE 3.

Comparison between the two trivial strategies. The figure shows the cost J defined in (5) for the alternating strategy (green curve) and the first doses only strategy (blue curve) defined in Section 4.1, for different values of the velocity of loss of partial immunity . The left plot shows the results for the AstraZeneca vaccine, the right one for Pfizer–BioNTech
