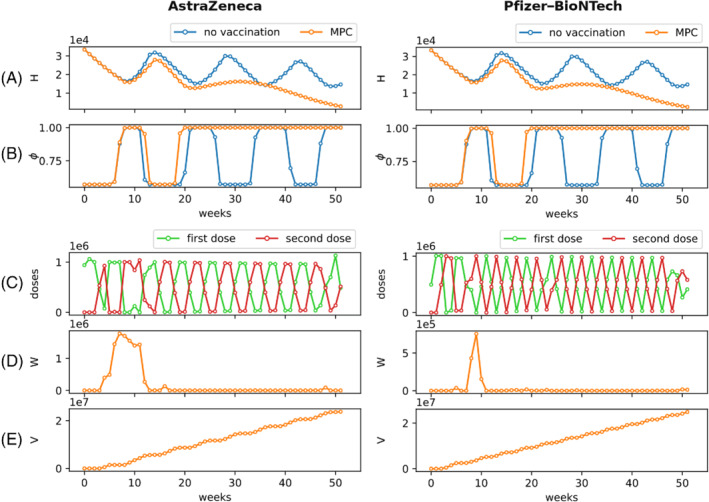
FIGURE 4.

Optimal vaccination rollout. On the left, we show the results of the MPC for AstraZeneca, on the right those for Pfizer–BioNTech (see Table 1). In (A), we compare the temporal evolution of the number of hospitalized individuals without vaccinations (blue curve) and implementing the optimal strategy proposed by the MPC (orange curve). In (B), we compare the temporal evolution of social activity as an indication of the timeline of NPIs in the absence (blue curve) and presence (orange curve) of vaccination. The panels in (C) illustrate the number of first doses (green) and second doses (red) that should be performed each week, under the optimal rollout computed using the MPC. The temporal evolutions of the number of individuals who are ready to receive the second dose, but for whom the second dose is delayed , and of the number of fully vaccinated individuals are reported in panels (D) and (E), respectively. MPC, model predictive control; NPI, nonpharmaceutical intervention
