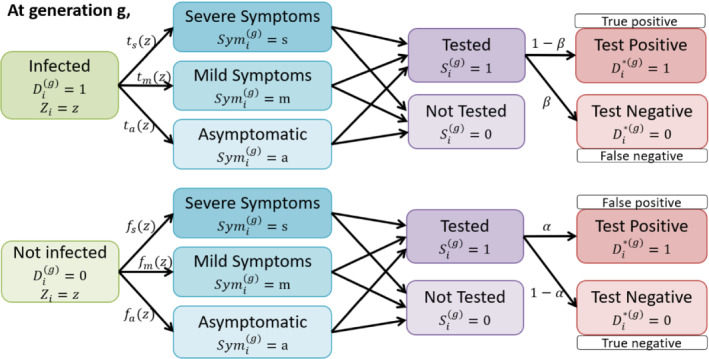
FIGURE 1.

Illustration of data structure at generation g with the incorporation of selection and misclassification. For a person i with the characteristic information(or risk factors) at the beginning of generation g, the true infection status is unobserved, with 1 indicating being infected and 0 being uninfected. The probability for an infected person of developing severe(s)/mild(m)/no(a) symptoms is , where , which is based on the characteristics. An uninfected person may also develop similar symptoms due to other diseases, for example, influenza, and the probability is . Often, people are tested/selected based on symptoms and some other risk factors. and are the false negative and positive rate for the test
