FIGURE 5.

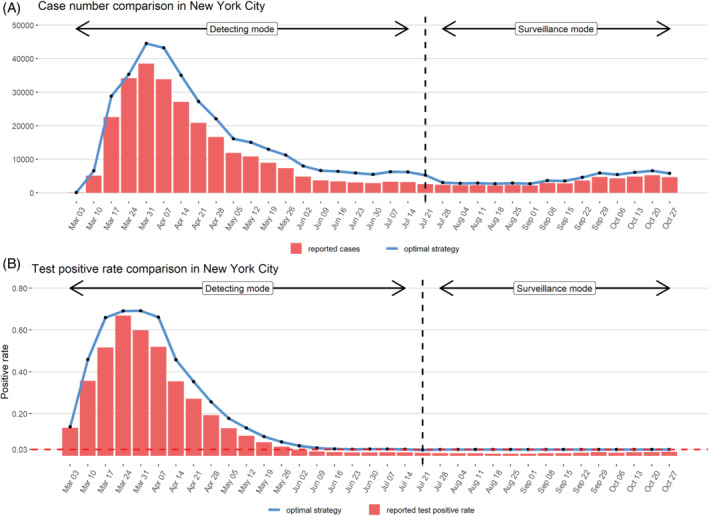
Comparison of predicted positive test number and test positive rates under optimal testing strategy to values observed for New York City in the year 2020 assuming a case under‐reporting factor of 4

Comparison of predicted positive test number and test positive rates under optimal testing strategy to values observed for New York City in the year 2020 assuming a case under‐reporting factor of 4