
Figure 3.
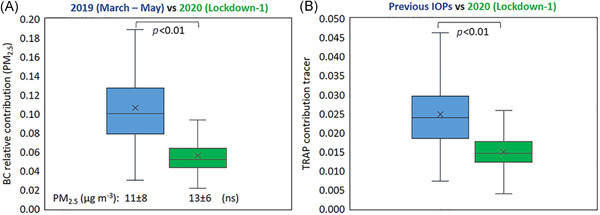
(A) Black carbon relative contribution to PM2.5 during the March to May calendar period (lockdown‐1) in 2019 (blue) and 2020 (red); PM2.5 average mass concentrations are also reported (ns indicates that differences in mass concentrations between 2019 versus 2020 resulted as not significant); (B): f57 signal in the organic mass spectra of NR‐PM1 (TRAP signal) as measured in intensive observation periods (IOPs) during lockdown‐1 and during previous experimental campaigns at the urban background supersite of Arpae in Bologna. Not significant (ns) and p refer to Student's t test [Color figure can be viewed at wileyonlinelibrary.com]