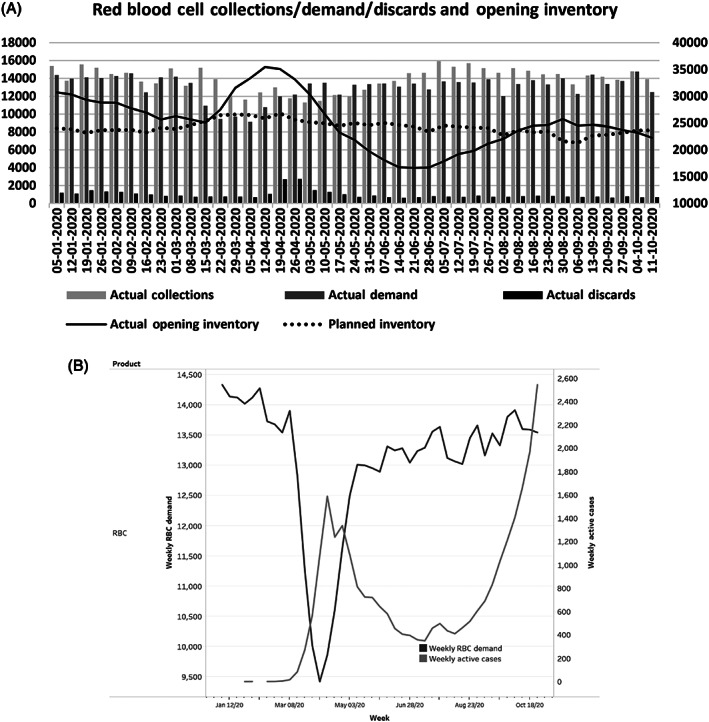
FIGURE 2.

(A) Canadian Blood Services (CBS) red blood cell (RBC) inventory from January 5, 2020 to October 11, 2020. This figure illustrates the number of RBC units actually collected, discarded onsite, and issued to hospitals (demand) from CBS indicated by the bars (y‐axis left). The solid and dotted lines represent actual and planned total number of RBC units in inventory at CBS (y‐axis right). (B) National weekly RBC demand versus population COVID‐19‐positive active case load: February 2020 to October 2020. This figure demonstrates the impact of the first wave of the pandemic on RBC demand in Canada. The left axis and heavy black line demonstrate the early drop in national RBC demand due to initial healthcare system closure, followed by a resumption of urgent care hospital services and return to a reduced but stable RBC demand. The right axis and gray line show the concurrent weekly active COVID‐19 cases in Canada. Despite the gradual growth in COVID‐19 cases nationally into the autumn months, RBC weekly demand remained stable
