
FIGURE 4.
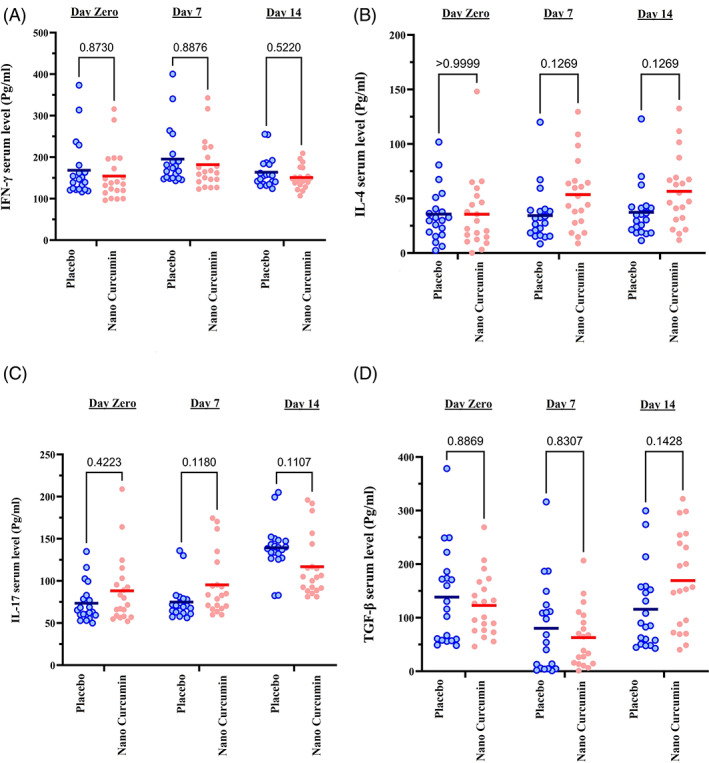
COVID‐19 patients' serum level measurements of IL‐4, IFN‐γ, IL‐17, and TGF‐β cytokines in the nano‐curcumin and placebo groups at the three time points of 0, 7, and 14 days of treatments using ELISA technique. (a) IFN‐g serum level, (b) IL‐4 serum level, (c) IL‐17 serum level, and (d) TGF‐β serum level. The lines in the charts represent the mean value of variables. The point in the graphs represents one of the participants in the study. The two‐way ANOVA and Bonferroni's multiple comparison Post‐Hoc test was used to evaluate the mean differences between placebo and nano‐curcumin groups in the time points