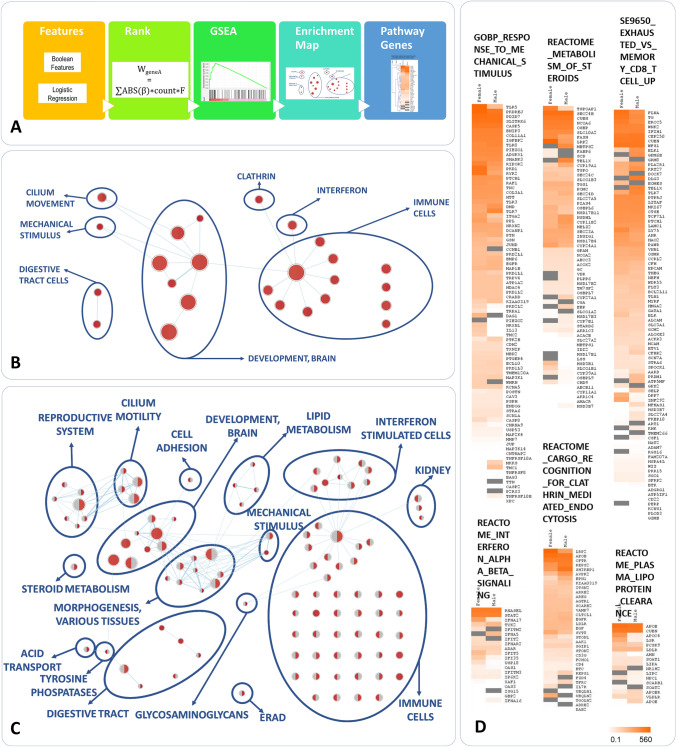
Fig. 4.
Pathway enrichment analysis of the genes associated with disease severity/mildness. A Workflow of the analysis. Genes corresponding to Boolean features found to be associated at least once were ranked based on a composite score and subjected to Gene Set Enrichment Analysis. Two separate ranked gene lists for females (7317 genes, weight range 3 × 10⁻⁵-561) and males (7325 genes, weight range 7 × 10⁻⁵-452) were used. The list of significant pathways was analysed and presented as a similarity network: B Similarity network of the pathways with a significant enrichment both in females and males (p < 0.01). The size of the circles is proportional to the pathway size. Significance above threshold is indicated by the red color. C Similarity network of the pathways with a significant enrichment either in females (red left half of the circles) or males (red right half of the circles) (p < 0.005). D Heatmaps of the genes belonging to a selection of pathways of interest. The color gradient represents the weight of each gene, calculated and described in methods. Please note high ranking of TLR genes (TLR5, TLR8, TLR3 and TLR7) in the pathway of Response to Mechanical Stimulus, CFTR gene in Recognition for Clathrin-mediated endocytosis, RNASEL, TYK2, OAS1 and OAS3 genes in Interferon alpha–beta signaling. Note also the presence of the relevant pathway of Exhaust vs Memory CD8 T cell Up that also includes TLR7 gene

