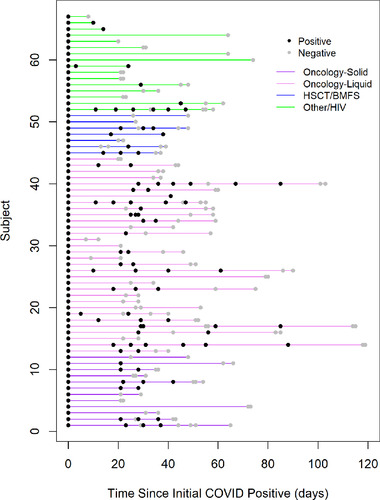
FIGURE 1.

Testing timelines plot of immunocompromised children in cohort with positive SARS‐CoV‐2 PCR and subsequent testing (n = 67). Legend: Line segment plot of immunocompromised children in cohort with positive SARS‐CoV‐2 PCR with subsequent testing, grouped by immunocompromising condition. Each line represents an individual patient. Positive results are shown in black, negative results are shown in light grey
