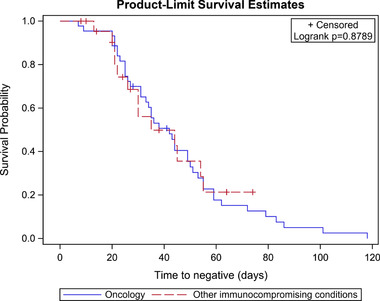
FIGURE 2.

Kaplan–Meier survival estimates for all children in study cohort with oncologic diagnoses and other immunocompromising conditions demonstrating time to first of two negative tests (n = 67). Legend: Kaplan–Meier survival curves demonstrating time in days to first negative SARS‐CoV‐2 PCR for children with oncologic diagnoses (blue) compared with children with other immunocompromising conditions (red). p‐Value was calculated using the log‐rank test
