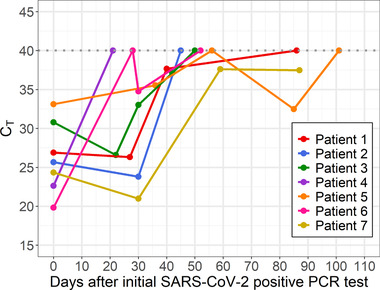
FIGURE 3.

Plot of C T values from SARS‐CoV‐2 PCR testing over time among children with sequential samples available for retesting (n = 7). Legend: Plot of mean C T values (y‐axis) from SARS‐CoV‐2 PCR testing on the CDC assay over time (x‐axis) in days from initial positive test. Repeated testing that yielded a negative result on the CDC assay or intermittent negative results on clinical testing represented as C T value of 40. Each line represents a unique patient. Clinical information regarding each patient is shown in accompanying Table S3
