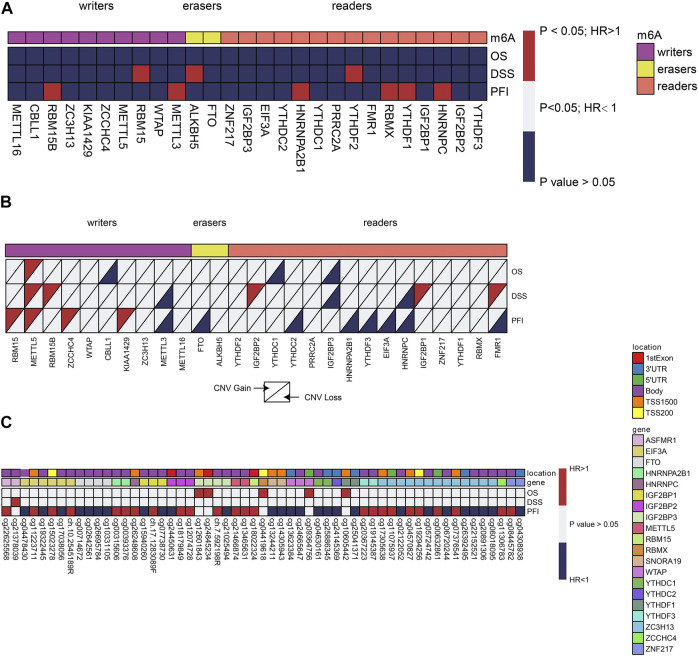
FIGURE 2.
Univariate cox regression analysis of m6A regulators. (A–C) Univariate cox regression analysis of the association between overall survival (OS), disease-free survival (DFS), or progression-free survival (PFS) and gene expressions. Blue box, protective factors (HR < 1 and p < 0.05); Red box, risky factors (HR > 1 and p < 0.05); white box, p > 0.05. The sample size used in each cox regression analysis was marked in brackets.

