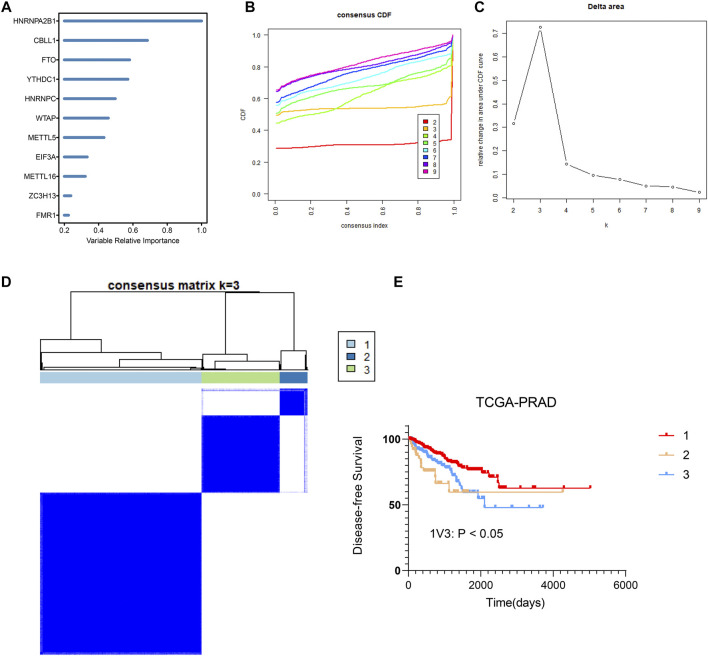
FIGURE 4.
Identification and consensus clustering analysis of m6A regulators (A) Random forest analysis ranking the importance of m6A regulators in prostate cancer based on their gene expression levels. (B,C) Relative change in area under cumulative distribution function (CDF) curve based on results of consensus clustering for k = 2 to 9. (D) Consensus clustering matrix for k = 3. (E) Comparison of DFS between group 1、group 2 and group 3 samples in prostate cancer.

