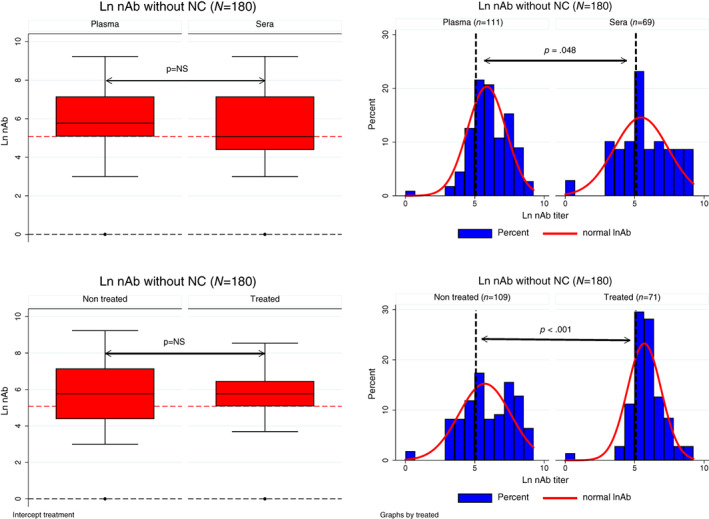
FIGURE 2.

Left: Box‐plot from nAb titer (natural log) from CCP donor samples, based on plasma or sera (top left) or pathogen reduction treatment (bottom left); with no statistical difference between groups (Mann–Whitney test); negative controls (NC; n = 11) were excluded. Right: Histogram density distribution of nAb titer (natural log), based on material (plasma or sera, top right), or pathogen reduction treatment (bottom right); both had a statistical difference in nAb titer distribution, (p = .048 and < .001, respectively, by the chi‐square test Χ2). The vertical dashed lines represent nAb titer ≥160 [Color figure can be viewed at wileyonlinelibrary.com]
