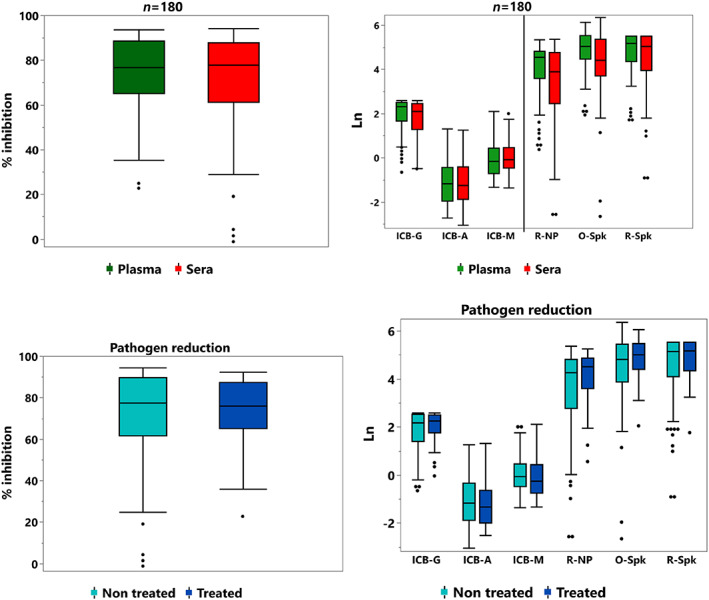
FIGURE 3.

Median reactivity of anti‐SARS‐CoV‐2 tests from 180 samples, based on material (plasma and sera, upper quadrants) or pathogen reduction treatment (lower quadrants). Negative controls were not included, as they did not bear any SARS‐CoV‐2 Abs. There is no statistical difference in reactivity for each test based on plasma/sera or non‐treated/treated samples. Except for anti‐RBD test (given in % inhibition – left), all signal/cut‐off (S/CO) ratio were normalized into natural logarithm. ICB‐G, anti‐IgG NP; ICB‐A, anti‐IgA NP; ICB‐M, anti‐IgM NP; R, Roche; O, Ortho; Spk, Spike; NP, nucleoprotein [Color figure can be viewed at wileyonlinelibrary.com]
