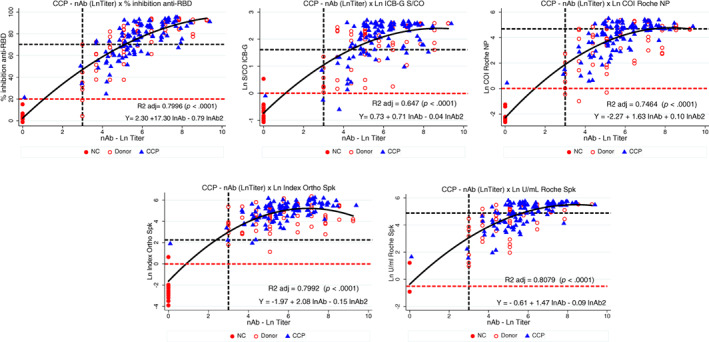
FIGURE 4.

Quadratic regression between lnAb and anti‐RBD (% inhibition, upper left); ICB anti‐IgG NP (Ln S/CO, upper middle); Roche NP (Ln COI, upper right); Ortho Spike total (Ln Index, bottom left) and Roche Spike (Ln U/ml, bottom right). Horizontal red and black dashed lines represent reactive reactions based on manufacturer's instructions and according to the FDA authorization, respectively (except for ICB‐IgG, which was defined as S/CO ≥5.0); vertical black dashed line marks nAb titer ≥160 [Color figure can be viewed at wileyonlinelibrary.com]
