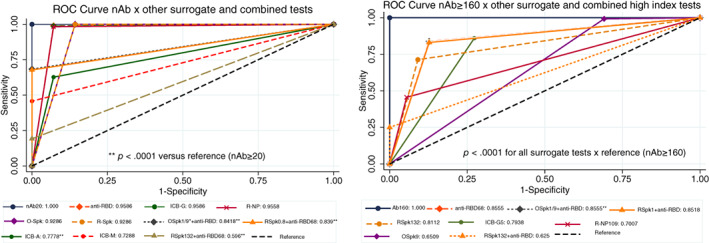
FIGURE 5.

ROC curve for surrogate tests compared against samples with nAb titers ≥20 (gold standard, left) or nAb titers ≥160 and FDA authorization for high‐titer samples (right). Except for ICB‐A, ICB‐M, and all combined tests (O‐Spk+anti‐RBD68 or R‐Spk+anti‐RBD68), all methods were statistically non‐significant whenever nAb titers ≥20 and manufacturer's instructions were followed (left); however, all surrogate methods following FDA authorization were statistically inferior (p < .0001) when compared to samples with nAb titers ≥160 (right). ICB‐A and ‐M were not shown in the right quadrant, because they already were statistically different by the former analysis. nAb20, neutralizing antibody titer ≥20; anti‐RBD, competitive anti‐RBD inhibition test; anti‐RBD68, ≥68% competitive anti‐RBD inhibition test; ICB‐G, anti‐IgG NP; ICB‐A, anti‐IgA NP; ICB‐M, anti‐IgM NP; R‐NP, Roche NP; O‐SPk, Ortho Spike; R‐Spk, Roche Spike; Spk‐0.8 and Spk1.0, anti‐Spike tests based on the manufacturer's cut‐off; SPk109 and SPk132, anti‐Spike tests based on FDA guidance for high‐titer; NP, nucleoprotein. *Both combinations for O‐Spk+ anti‐RBD68 presented the same result, being merged into a single line. **p < .0001 against reference (nAb20) [Color figure can be viewed at wileyonlinelibrary.com]
