
Figure 2.
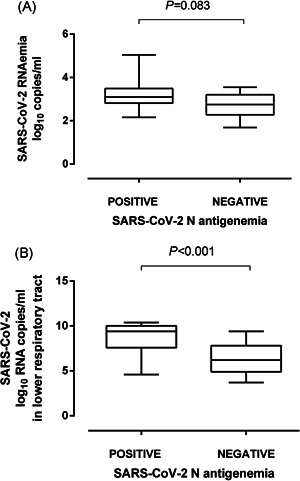
Box‐plot depicting SARS‐CoV‐2 RNA load (in copies/ml) in plasma (A) and tracheal aspirates (B) from critically ill patients in the presence or absence of SARS‐CoV‐2 N protein. p‐value for comparison is shown
Official websites use .gov
A
.gov website belongs to an official
government organization in the United States.
Secure .gov websites use HTTPS
A lock (
) or https:// means you've safely
connected to the .gov website. Share sensitive
information only on official, secure websites.
Box‐plot depicting SARS‐CoV‐2 RNA load (in copies/ml) in plasma (A) and tracheal aspirates (B) from critically ill patients in the presence or absence of SARS‐CoV‐2 N protein. p‐value for comparison is shown