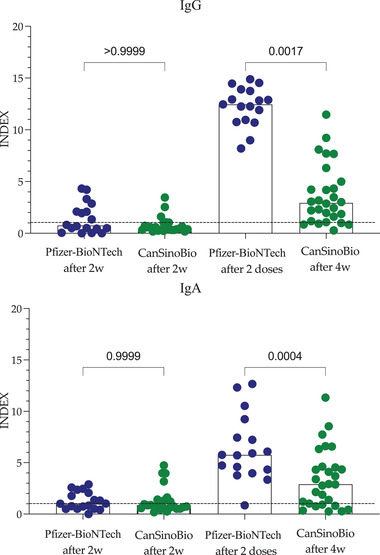
FIGURE 6.

IgG and IgA antibodies of individuals naïve to COVID‐19 in response to CanSinoBio or Pfizer‐BioNTech vaccine. Bars represent the median, and each circle represents an individual. Differences were analyzed with the Kruskal–Wallis test and Dunn's multiple comparisons test. p values indicate the response of individuals with a history of COVID‐19 versus naïve to COVID‐19. INDEX values > 1 are positive
